Wednesday, July 17, 2013

Day 26 RET summer training

Day 26

After 4 hours of shifting wires and moving parts around yesterday we were finally able to test each of our controls, collect data, and produce great graphs.

If you watched the videos from yesterday you saw how we manipulated each control in an isolated volume of water. After adding a disturbance for pH there is no immediate control input, instead there is a 2 min delay but we do continue to gather data into our database. The actuator only dispenses after the average results are collected. This average, if you recall, are 10 data points or collections at 8 seconds apart. So a total of 80 sec. passes before there is some action from actuator. Vardhman programmed the system this way to allow the added control (fluid, etc.) to diffuse through water before taking the appropriate next steps. The disturbance in this experimental trial was added at 20 sec. (pH right above 7), levels dropped to just under 7 (fluctuating a little), and after 2 minutes a volume of pH corrector was added; system continued to collect data, averaging points. One factor different to this graph compared to all others is that Vardhman's algorithm allows for a much smoother sloped line and removes every data point collected every 8 sec. that would otherwise show sharp and steep lines. The graph also shows where control is turned off and levels rise back to normal. The reestablished conditions of our sampled water is a reliable control system.

 Recall this block diagram for pH:

                               
Similar to pH we used an isolated volume of water to test tank refill. The video shows how we used Velcro to constrain two sonars and pumped water from a reservoir. We started our data collection with water height of 19 cm, pump turned on for a total time of nearly two minute until the desired depth of 14 cm, pump then turned off.


 Recall DO block diagram:


Our food dispenser in action:

http://www.youtube.com/watch?v=ElC4d9C1gHY&feature=youtu.be
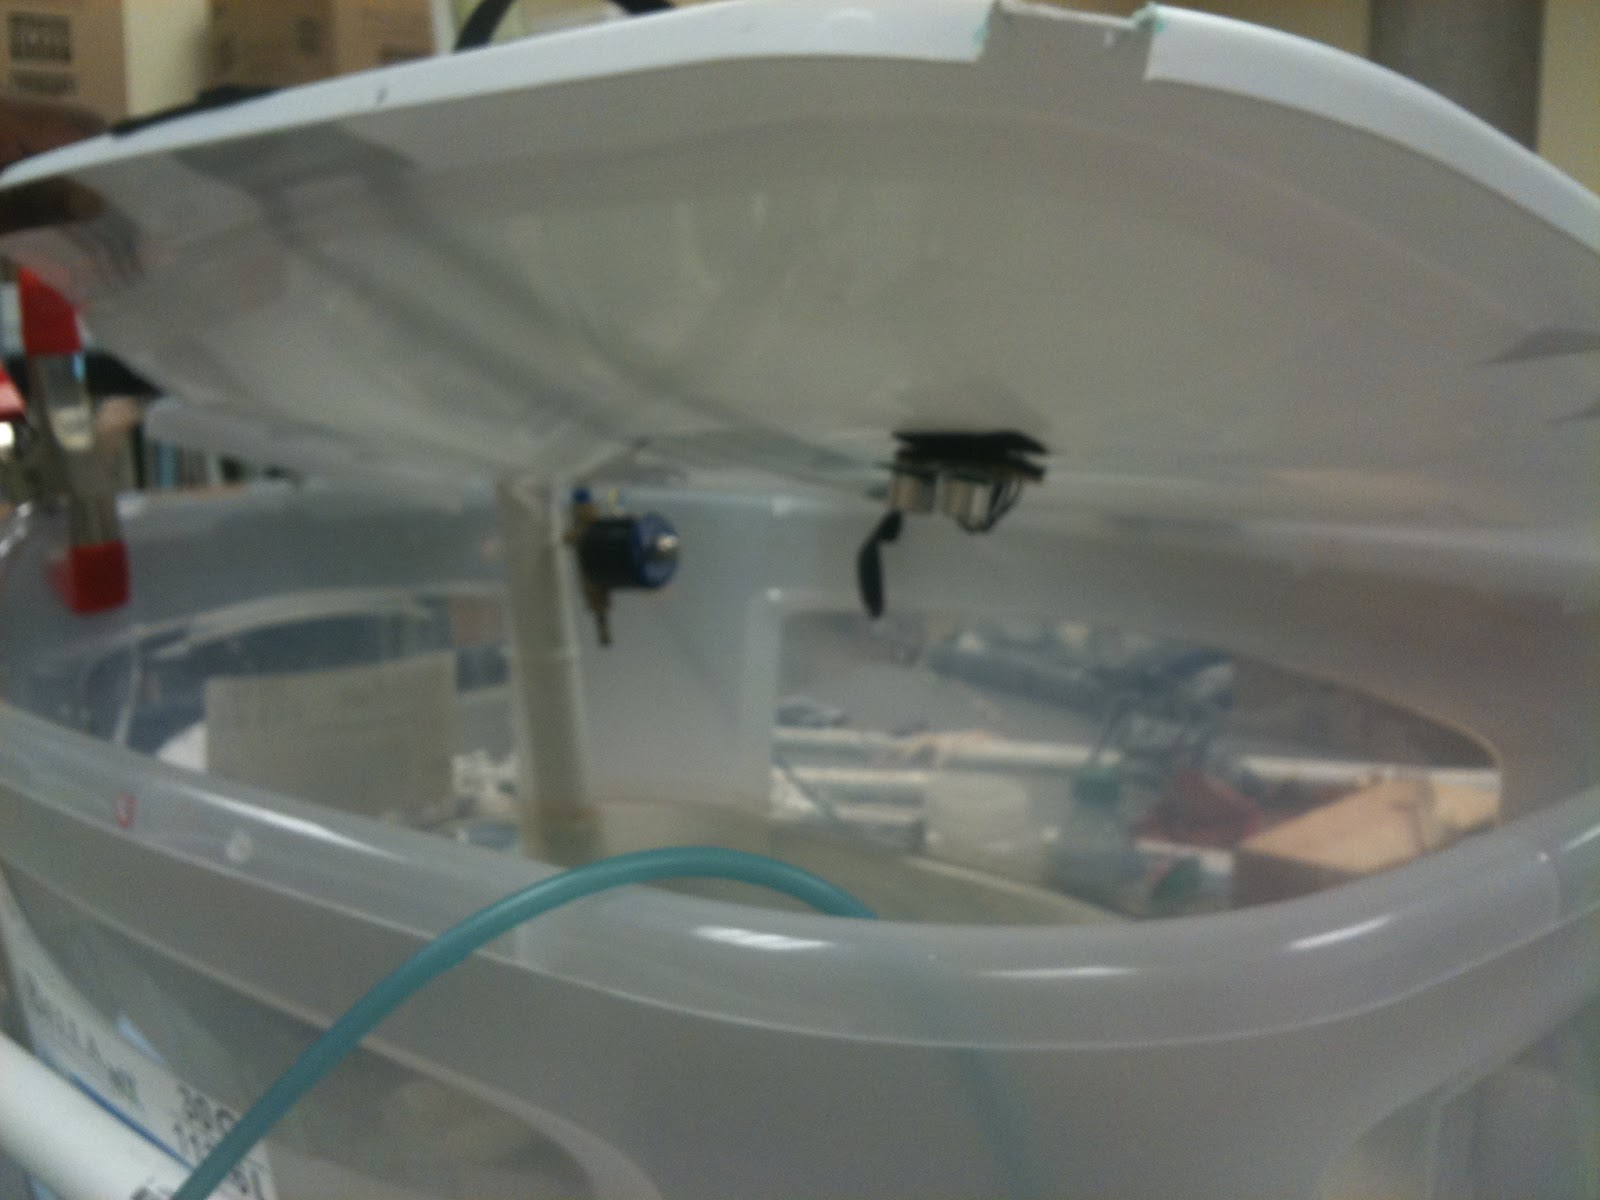
Pic of dispenser:


Tuesday, July 16, 2013

Day 25 RET summer training

Day 25

Today was entirely devoted to simulating and videoing each of the controls. See videos below. The difficulty in simulating each control is that there are many factors that come into play- most importantly time. We needed to manipulate the environmental conditions in a lab that would otherwise be found in nature. Also, because we are working with parts that require a power source, the use of multiple outlets and power strips made our testing area fairly tight and problematic. Finally, we are working with electrical components that we all know do not mix well with water, so it took time when stationing for demonstration. Our final circuit system unfortunately was not soldered together so Vardhman needed to connect the appropriate wires for each control--again taking time. We have thought of a good way to cut time for Thursday's demo-- we will activate all controls in one tank (without fish), have a central location for V's laptop, have two power strips within arm's reach, station sensor cluster next to tanks lid (possible).

Demo:
For water level- we will take initial water level reading (say 18cm), set system to fill to a depth of 15cm, the pump will refill tank until this point; system (pump) should then turn off.

For pH-- we will take initial pH reading in an isolated container, create a mix of acidic solution, drop solution very close to sensor, watch dispenser activate (similar to video).

For DO levels-- we will not simulate as changes require much more time. We will show video on Friday.


Video for water refill:
http://www.youtube.com/watch?v=AKInu9I2P3Y&feature=youtu.be

Video for dissolved oxygen:
http://youtu.be/ODVzNSf-Km4

Video for pH:
http://www.youtube.com/watch?v=L-AN6qAb5Ws

We have more graphs:
With Vardhman's developed algorithm we plot only the averaged points of data rather than all 8 sec. points. This way our graph line shows steady and not sharp rise and falls.The graphs below are an extension of yesterday's graphs and not the data collected today with controls implemented. Those will come tomorrow.

DO staying constant.
pH also remaining constant.
Equally, temperature shows almost no fluctuations.

Our sensor cluster works and is reliable!


Monday, July 15, 2013

Day 24 RET summer training

Day 24

We came back from the weekend to find DEAD Fish! NOOOOO! We left all systems running over the weekend, this includes controls. During our 24 hr data collection the prior week we saw that pH levels drop for several hours during the day but we did not have enough data to see what time they come back up. In any case, we expected pH dispenser control to do it's job. Problem- the processing time of 8 seconds is too short of a window for conditions to stabilize. pH dispensed needs more time to mix with water. The 8 second response kept the dispenser "dispensing" eventually draining the reservoir dry. About 1/2 of solution bottle was dispensed and as a consequence killed several of our fish. It is difficult to assure that no harm will happen to life when experimenting and creating systems that are currently not in place. We did not expect this loss and thought our plan was solid. We will try deploying either today or tomorrow and will make sure to remove all fish. On the other hand, we had an inch growth in our plants over the weekend. We will continue measuring growth for the next few days but it would be interesting to see if we had more growth with high pH than normal pH levels (7.1-7.5) these next few days. We will see.


Not good:(

We have our final data collection (not really, we were just told DO graph shows to many variable points, not a good thing when dealing with a control system that needs to conserve battery life--basically we'll have to set this control to take less data readings), see below:


Above. Temperature shows varying points but this is expected with the sensitivity of these sensors. Vardhman will work on an algorithm to remove these points.

Above. We will replace this graph tomorrow but for now black points shows control activated, DO levels rise shortly after; you see a pattern of low levels, black point, then a rise.
Above. Self explanatory (from left to right)-- DO sensor was dependent on temperature and DO limit was 7.5 (if DO falls below 7.5 control activated). Vardhman changed this to so that the limit for DO was 8.
Above. DATA.

A little under 2 days of data.

Above. pH levels maintained with control activated (top line):)


Above. This DO graph will most likely be replaced tomorrow.

Tomorrow's goal will be to add disturbances to an isolated volume of water, observe and record this data.

Friday, July 12, 2013

Day 23 RET summer training

Day 23

Big problem this morning. The circuit which would incorporate all 3 probes was not reading correct pH. Vardhman thinks that as he was soldering parts onto one circuit board he might have soldered the ends of DC-DC converter together causing a short circuit. This is common when soldering. Patience and precision are key; not to say he didn't know what he was doing but these kinds of things happen all the time (4th and 5th pics show what we should expect by early next week-- the soldering problem is in there somewhere). Luckily Vardhman found a second DC-DC converter. So we should be set with cluster by next week. Fingers crossed!

Because we need to collect data over the weekend, Vardhman developed the circuitry below. If you've been keeping up with posts, the problem with collecting data simultaneous from probes is a voltage interference. The use of 2 arduinos as shown in picture isolates each probes voltage (each probe receiving 5V). The 3rd arduino collects information from 1 & 2 and with the use of Xbee transmits data remotely. From looking at the data and plotting a graph we will see at what time controls were activated. pH is the easiest to tell as we can visually look at dispenser and see a volume displacement. We will manipulate controls before we leave today by adding disturbances for DO levels, refilling tank (sonar pic below), and food disperser.

Our graph is created using MATLAB which is is a numerical computing environment and fourth-generation programming language. See pic below:


We are collecting data every 8 seconds. I'll describe our data using the third row of numbers:
26.43, 0, 7.20, 0, 8.78, 1, 15
(Temp), (0= open current), (pH), (0=open current), (DO), (1= closed current), (water level)

Hopefully the last sensor cluster prototype


Great work! Somewhere hidden in the soldering path is the DC-DC converter short circuit.
 Top view

 Sonars for water loss in fish tank. A turn on/off system is incorporated here. Water displacement within fish tank will kick start system. We measured 7 inches from top of lid to water. The system activates at .7 in displacement. We will not get this much evaporated water over the weekend so will add disturbance today.


Velcrowed to bottom of lid


 Bubbler once again. Remember a .5 value drop in DO levels will turn on bubbler. This is also an on/off system.

We have a flower!! :D We started collecting aquaponic system success by measuring growth in our plants. I know it's kinda late to do this but I bet we'll get a 1 or 2 in. growth before Friday's presentation.

pH dispenser once again.

Food dispenser. All systems are a go! 

Top view.


Digital reading before deployment. This is an early picture, all readings stabilized shortly after. This is pretty cool!


Vardhman making sure everything is good to go. I actually asked him to pose. Normally he has his hands in there somewhere.

I changed our poster a little. The only things to add are our last data, graph, pics of completed cluster. Super excited!


Thursday, July 11, 2013

Day 22 RET summer training

Day 22

Here's the schematic from yesterday comment over isolation of DO and pH.


Back to working on our research paper and TechFest activity.Below is a preview to our poster:)


Wednesday, July 10, 2013

Days 20 & 21 RET summer training

Days 20 and 21

We are coming down to the wire! For the past two days we have worked on our research paper, lesson plan, and techFest activity. Not much to report in terms of our control systems. Although, Vardhman was able to produce a graph using Mondays- Tuesday 24 hr data collection (below).


I had posted the data table below two days ago but it accompanies the graph, so here you go!


 We are making progress on our research paper. Lesson plan has been turned in for audit--will be done by the end of the day. TechFest idea and supply list has been completed.

Vardhman gave us a quick workshop over the relay change he's made to sensor circuitry. Basically he isolated pH from DO to get a more accurate reading for each of the probes. Interference, leading to incorrect readings, was the BIG problem. A schematic of this change is shown below:


Monday, July 8, 2013

Day 19 RET summer training

Day 19

Over the 4 day break Vardhman came to our lab to drop our 3 sensors and we've started collecting real time data on a database he created (pic below). We are collecting data every 8 sec. but eventually we'll receive data every 40 seconds; this would give us a more realistic readings instead of any minute discrepancies from an 8 sec. reading. Vardhman also received a part which allowed him to close the circuit for our 3 sensors. More about that later.

This week we will focus our attention on implementing and testing our 3 controls-- pH dispenser, bubbler (DO), and reservoir for fish tank fill with the expectation of adding disturbances to test whether controls stabilize our tanks environment.

Sharron did us a huge favor and located several clams which we will add to our fish tank to serve as a bioindicator. Basically, clams have been used to test for high concentration of heavy metals (cadmium, copper, zinc, and lead) and fecal pollution in seawater (Salmonella).
http://www.csef.colostate.edu/2011_Abstracts/Milano_Victoria.pdf
http://link.springer.com/article/10.1007%2FBF00284629#page-1
Tissue tests were taken from these two studied species of clams, we of course do not have that technology but we know that when clams close there are environmental conditions that need to be looked at.


Our 3 clams serving as bio indicator